Newer
Older

Docker host & containers monitoring with [Prometheus](https://prometheus.io/), [Grafana](http://grafana.org/), [cAdvisor](https://github.com/google/cadvisor),
[NodeExporter](https://github.com/prometheus/node_exporter) and alerting with [AlertManager](https://github.com/prometheus/alertmanager).

## Install

Clone this repository on your Docker host, cd into dockerprom directory and run compose up:

* `$ git clone https://github.com/stefanprodan/dockerprom`
* `$ cd dockerprom`
* `$ docker-compose up -d`

Containers:

* Prometheus (metrics database) `http://<host-ip>:9090`
* AlertManager (alerts management) `http://<host-ip>:9093`
* Granafa (visualize metrics) `http://<host-ip>:3000`
* NodeExporter (host metrics collector)
* cAdvisor (containers metrics collector)

While Granafa supports authentication, the Prometheus and AlertManager services have no such feature.
You can remove the ports mapping from the docker-compose file and use NGINX as a reverse proxy providing basic authentication for Prometheus and AlertManager.
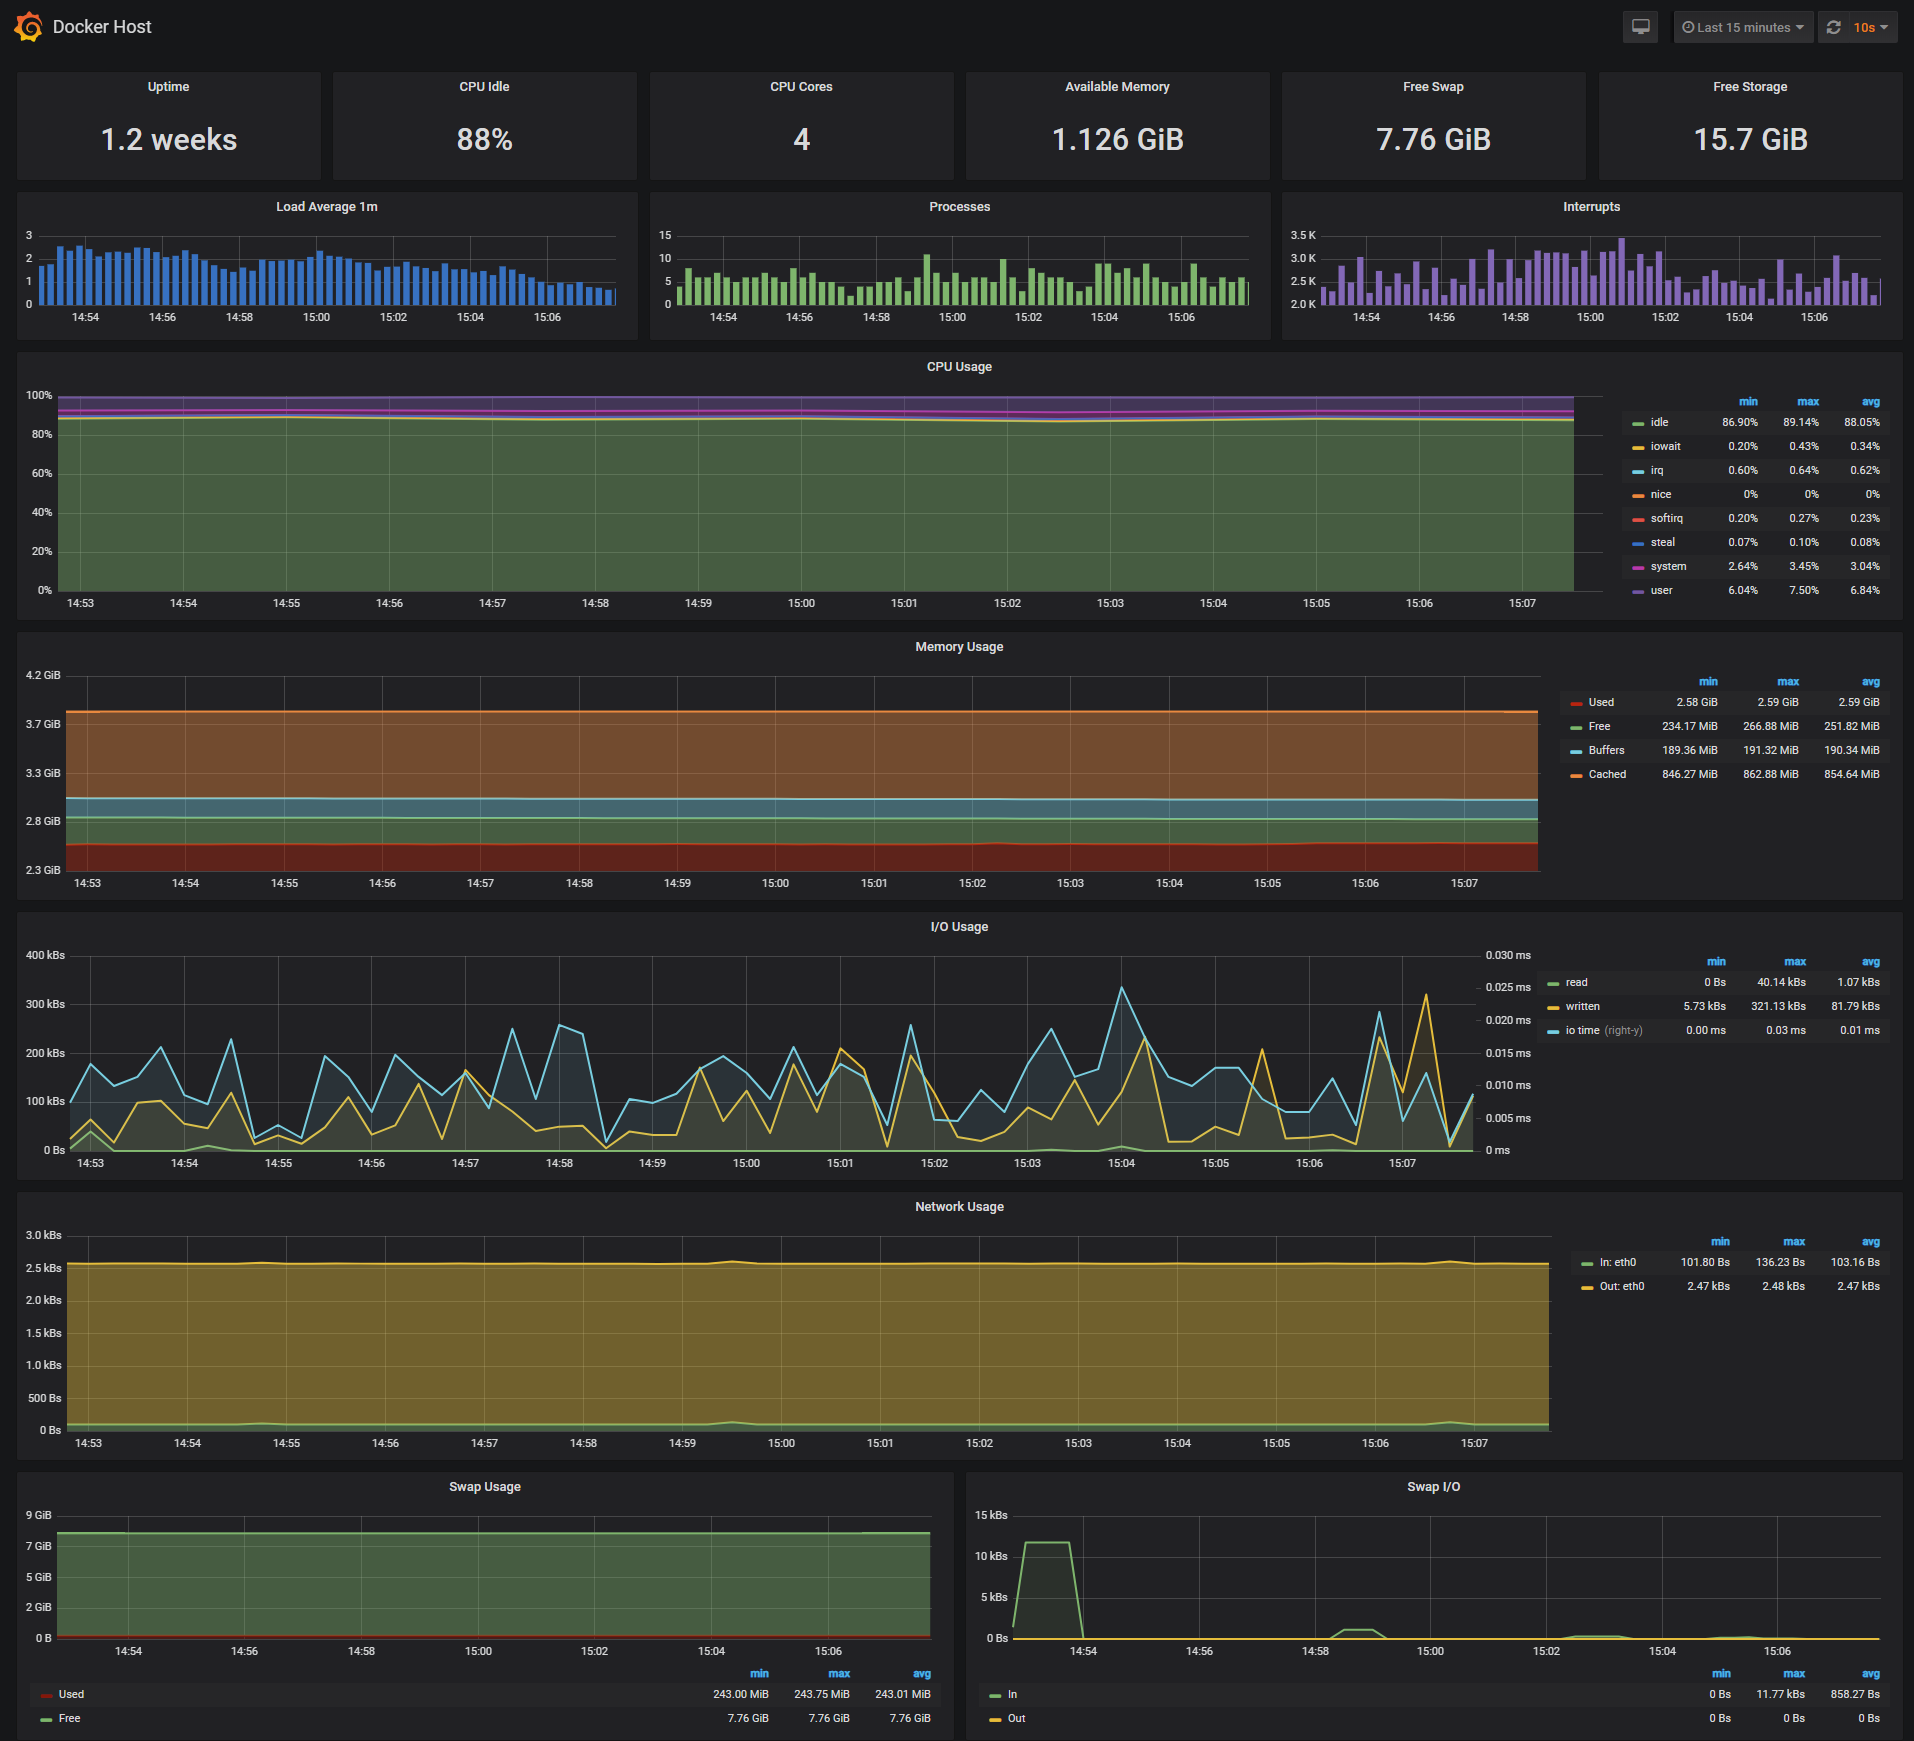
## Setup Grafana
Navigate to `http://<host-ip>:3000` and login with user ***admin*** password ***changeme***. You can change the password from Granafa UI or
by modifying the [user.config](https://github.com/stefanprodan/dockerprom/blob/master/user.config) file.
From the Granafa menu, choose ***Data Sources*** and click on ***Add Data Source***.
Use the following values to add the Prometheues container as data source:
* Name: Prometheus
* Type: Prometheus
* Url: http://prometheus:9090
* Access: proxy
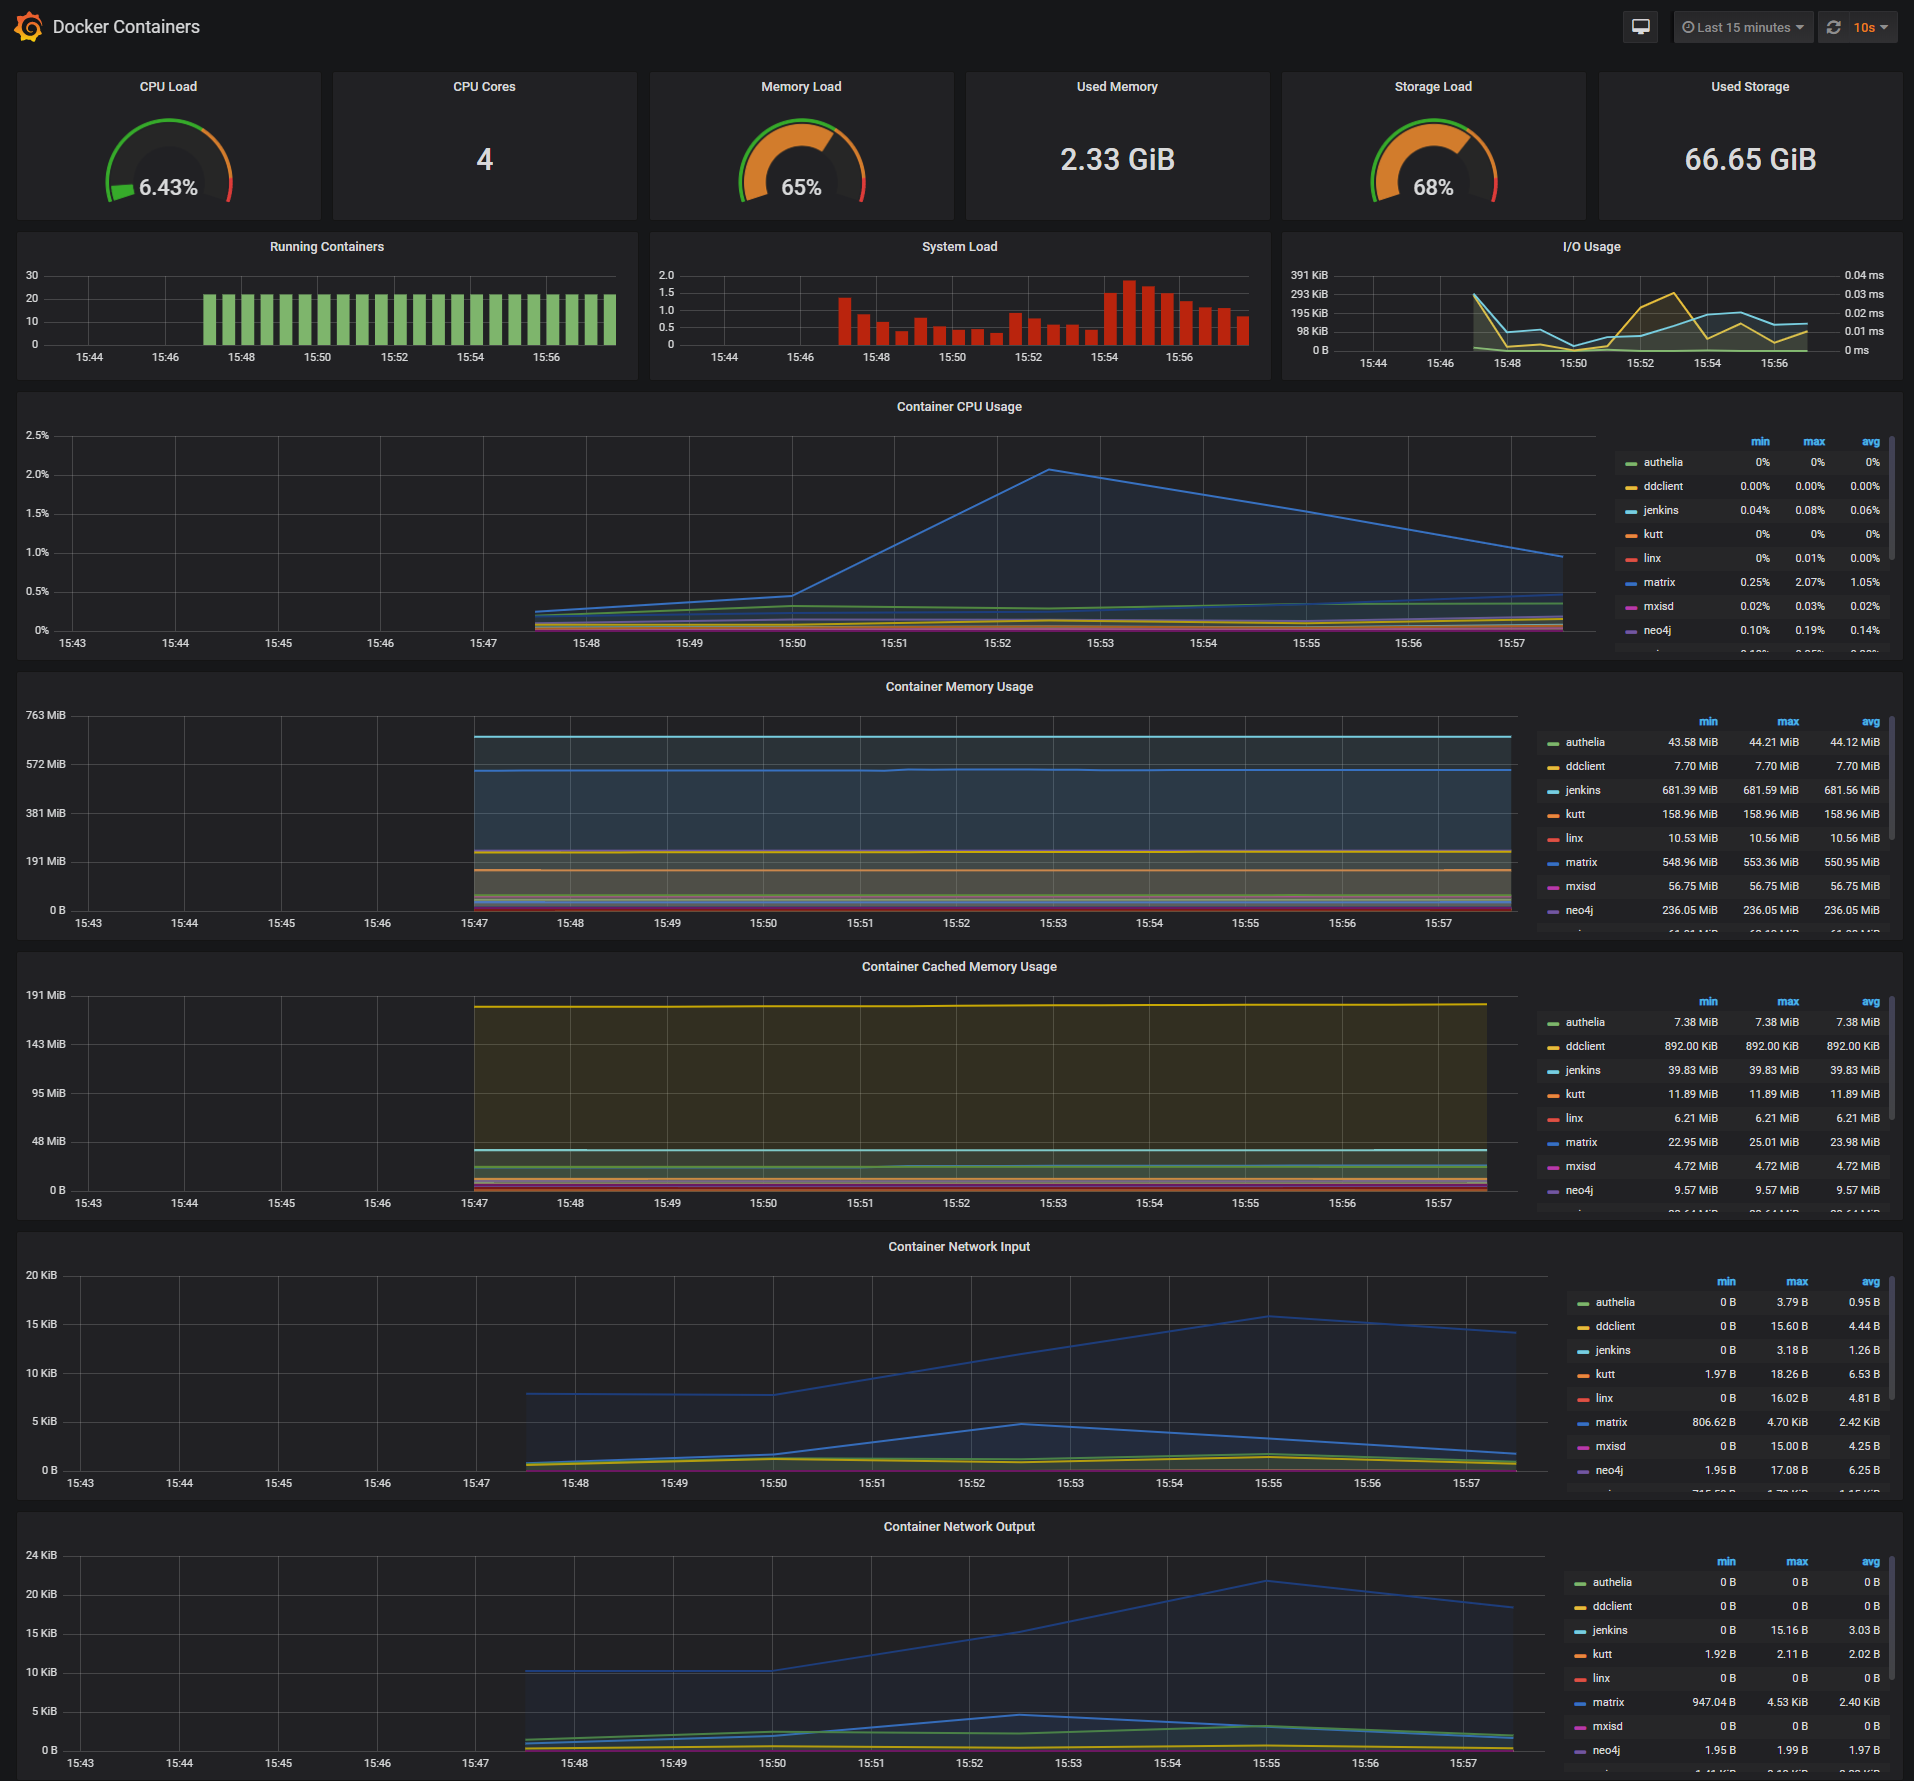
Now you can import the dashboard temples from the [grafana](https://github.com/stefanprodan/dockerprom/tree/master/grafana) directory.
From the Granafa menu, choose ***Dashboards*** and click on ***Import***.
***Docker Containers Dashboard***
***Monitor Services Dashboard***
