Newer
Older

Docker host & containers monitoring with [Prometheus](https://prometheus.io/), [Grafana](http://grafana.org/), [cAdvisor](https://github.com/google/cadvisor),
[NodeExporter](https://github.com/prometheus/node_exporter) and alerting with [AlertManager](https://github.com/prometheus/alertmanager).

## Install

Clone this repository on your Docker host, cd into dockerprom directory and run compose up:

* `$ git clone https://github.com/stefanprodan/dockerprom`
* `$ cd dockerprom`
* `$ docker-compose up -d`

Containers:

* Prometheus (metrics database) `http://<host-ip>:9090`
* AlertManager (alerts management) `http://<host-ip>:9093`
* Granafa (visualize metrics) `http://<host-ip>:3000`
* NodeExporter (host metrics collector)
* cAdvisor (containers metrics collector)

While Granafa supports authentication, the Prometheus and AlertManager services have no such feature.
You can remove the ports mapping from the docker-compose file and use NGINX as a reverse proxy providing basic authentication for Prometheus and AlertManager.
## Setup Grafana

Navigate to `http://<host-ip>:3000` and login with user ***admin*** password ***changeme***. You can change the password from Granafa UI or
 by modifying the [user.config](https://github.com/stefanprodan/dockerprom/blob/master/user.config) file.

From the Granafa menu, choose ***Data Sources*** and click on ***Add Data Source***.
Use the following values to add the Prometheues container as data source:

* Name: Prometheus
* Type: Prometheus
* Url: http://prometheus:9090
* Access: proxy

Now you can import the dashboard temples from the [grafana](https://github.com/stefanprodan/dockerprom/tree/master/grafana) directory.
From the Granafa menu, choose ***Dashboards*** and click on ***Import***.
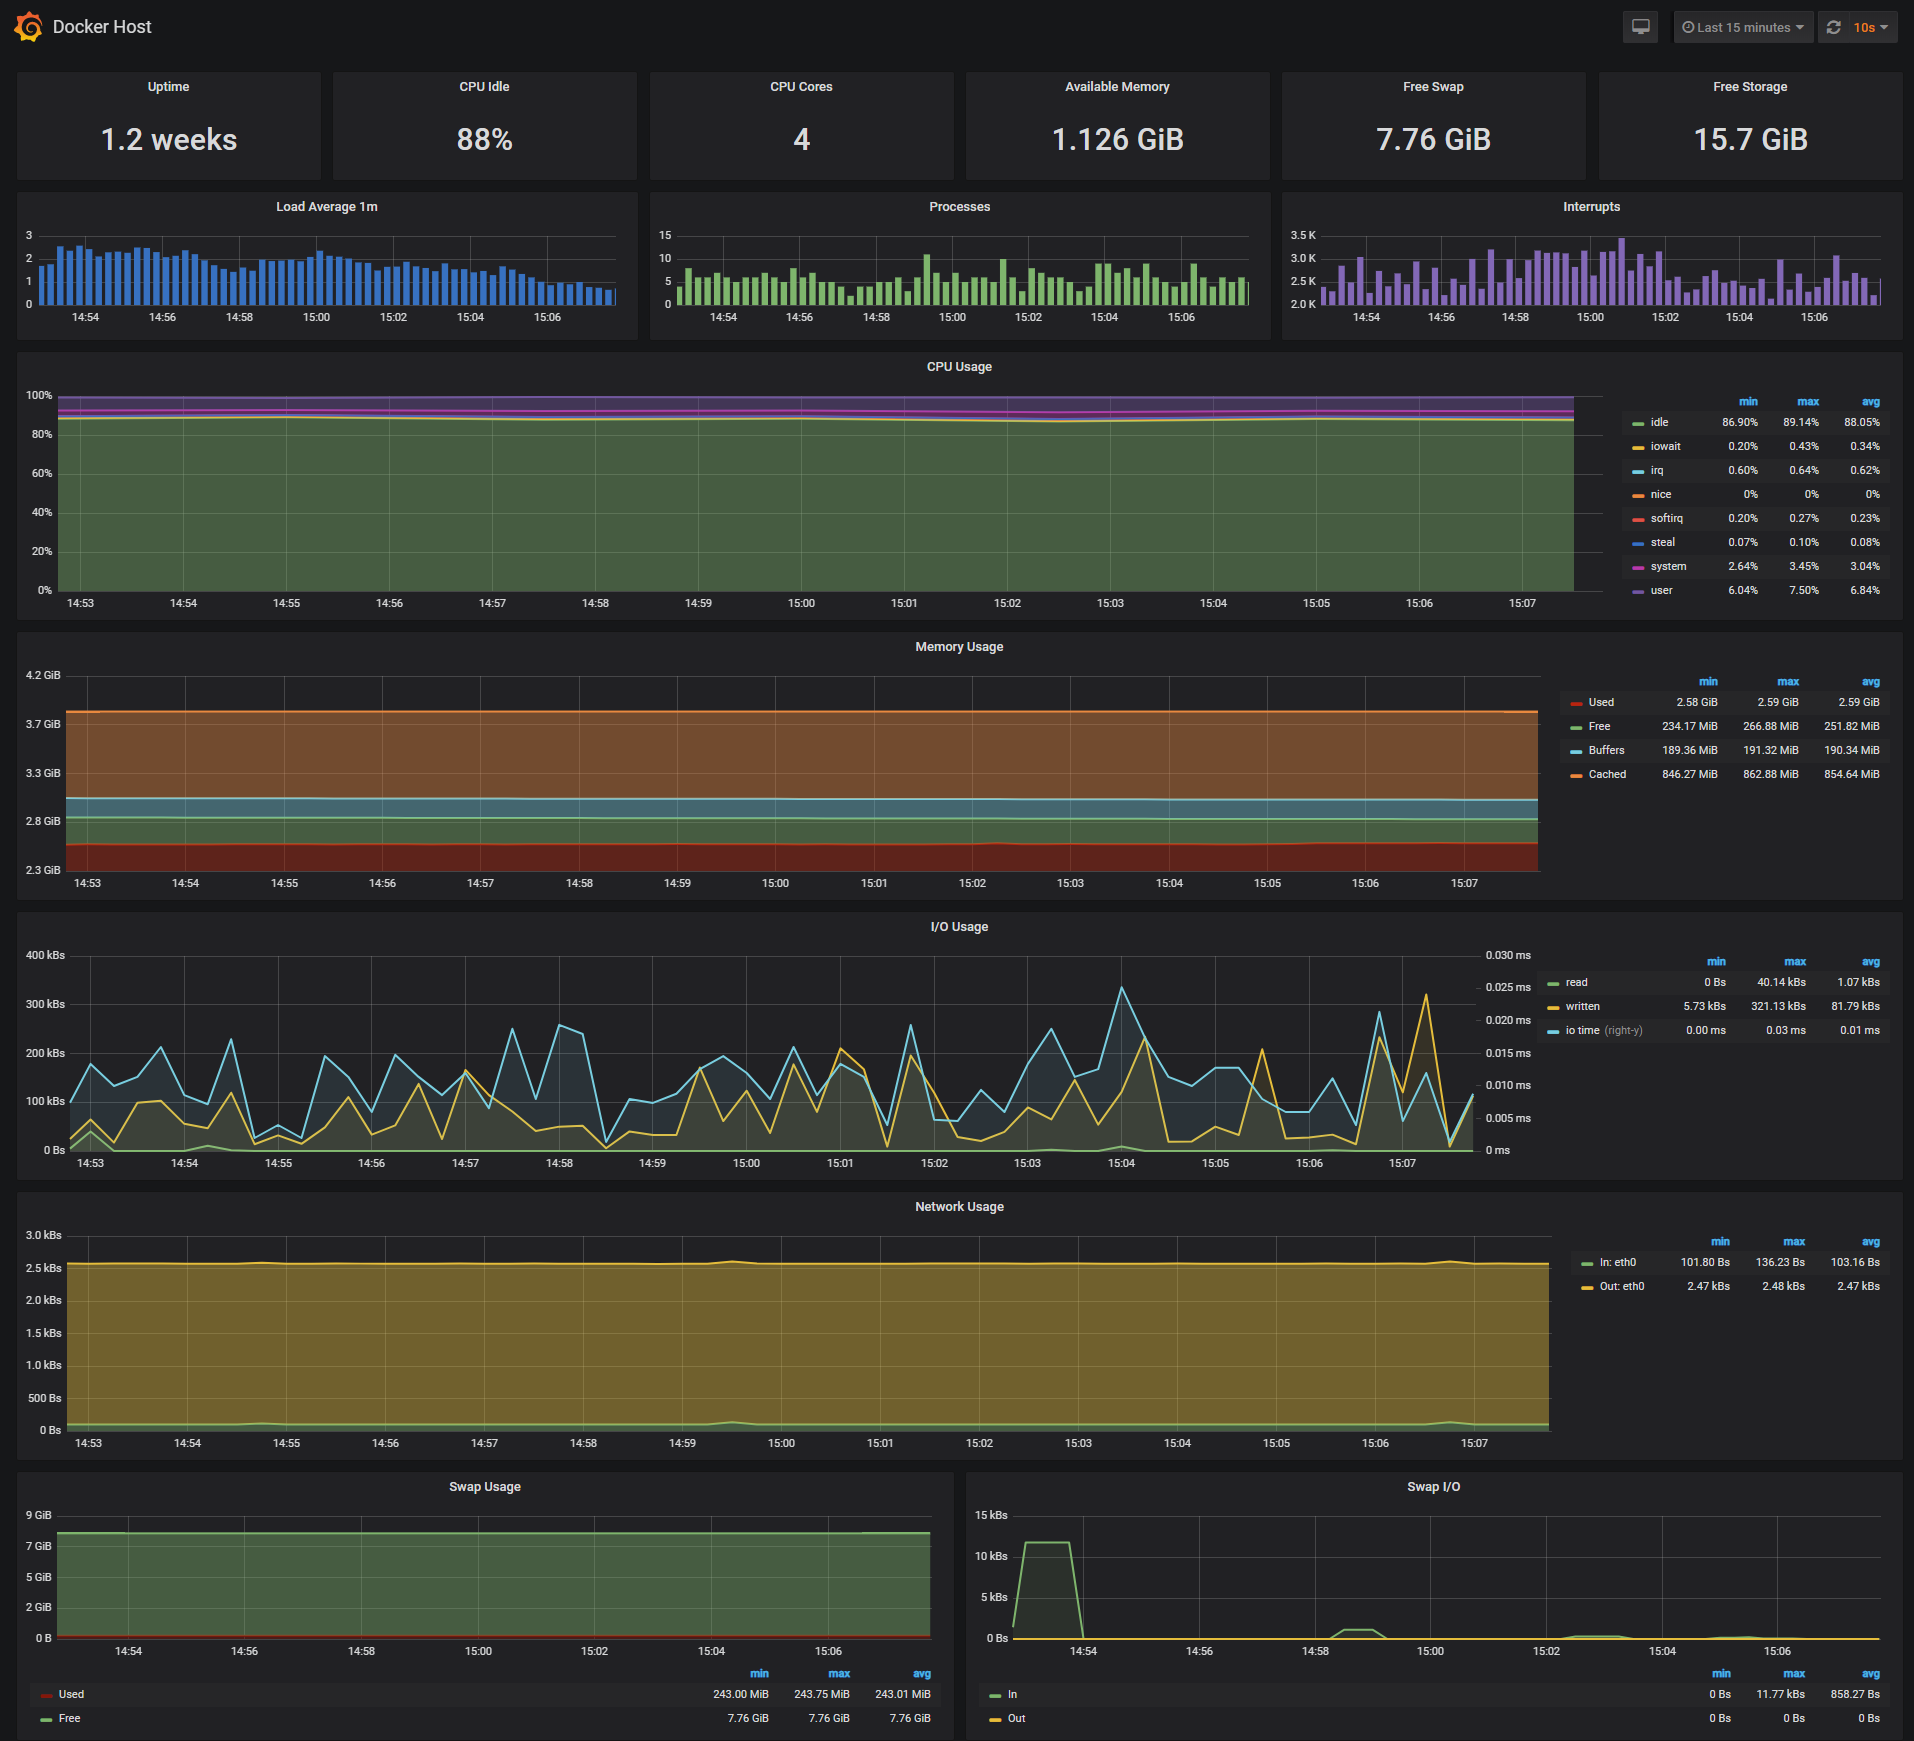
The Docker Host Dashboard shows key metrics for monitoring the resource usage of your server:

* Server uptime, CPU idle percent, numner of CPU cores, available memory, swap and storage
* System load average graph, running and blocked by IO processes graph, interrupts graph
* CPU usage graph by mode (guest, idle, iowait, irq, nice, softirq, steal, system, user)
* Memory usage graph by distribution (used, free, buffers, cached)
* IO usage graph (read Bps, read Bps and IO time)
* Network usage graph by device (inbound Bps, Outbound Bps)
* Swap usage and activity graphs
***Docker Containers Dashboard***
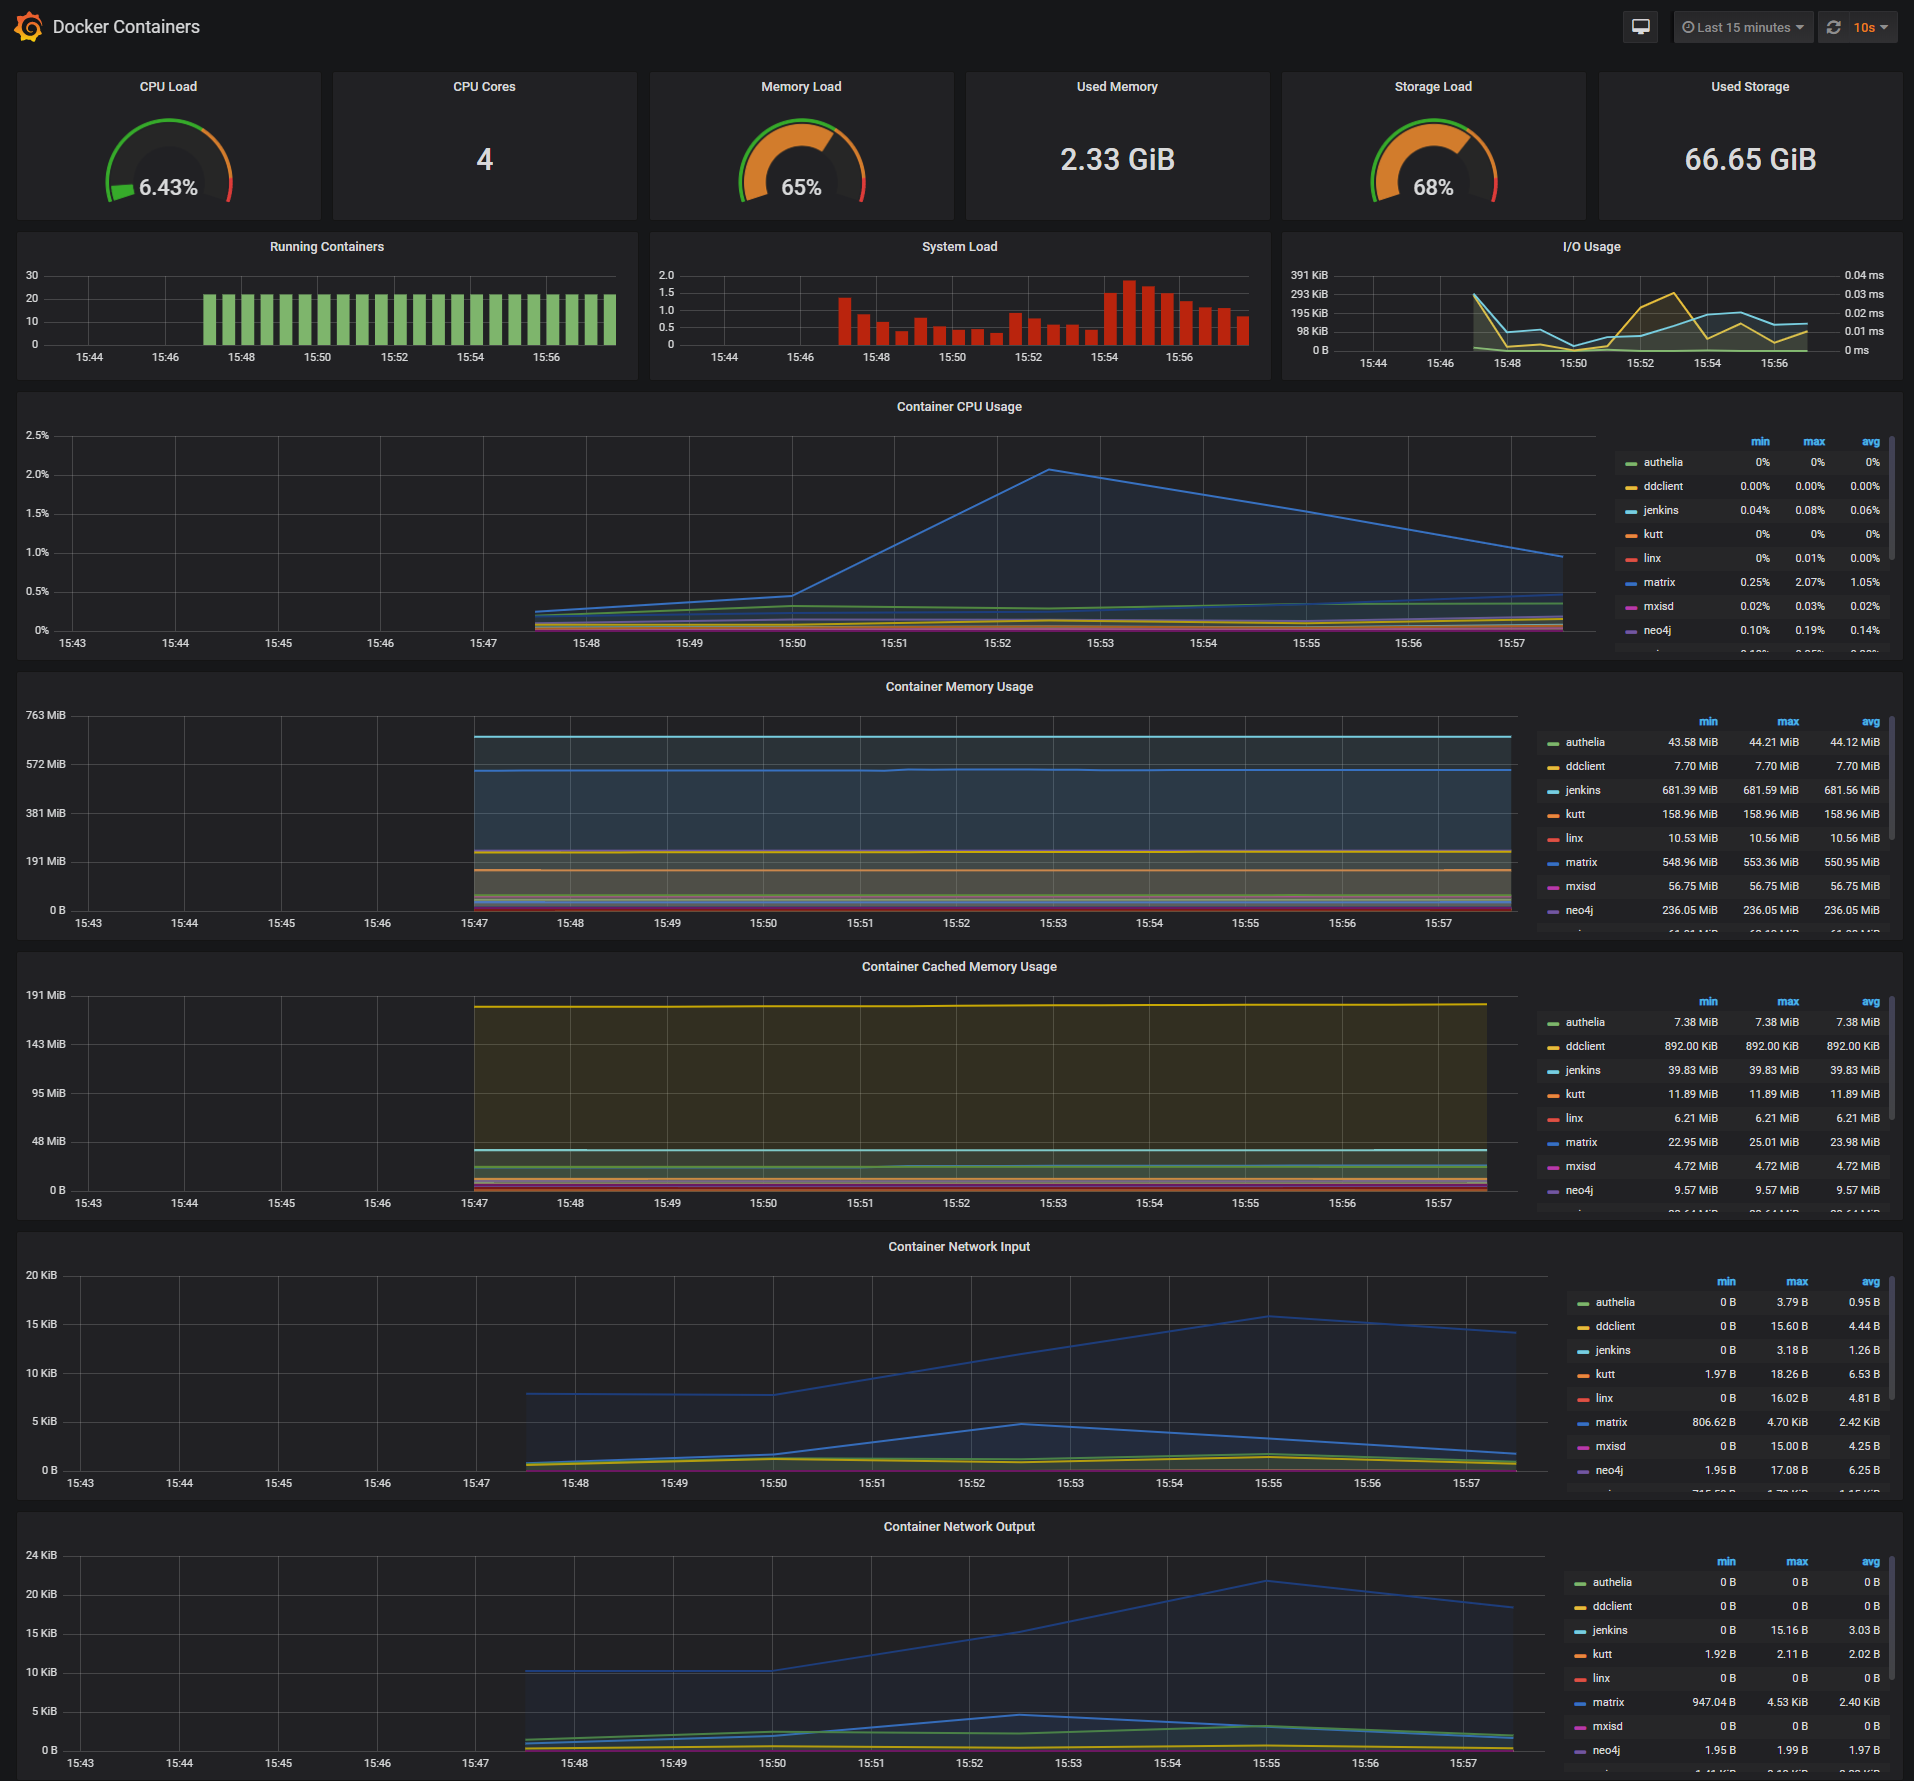
The Docker Containers Dashboard shows key metrics for monitoring running container:
* Total containers CPU load, memory and storage usage
* Running containers graph, system load graph, IO usage graph
* Container CPU usage graph depending on the number of cores your server has, if your server has 4 cores then a container usage can go up to 400%
* Container memory usage graph
* Container cached memory usage graph
* Container network inbound usage graph
* Container network outbound usage graph
Note that this dashboard doesn't show the containers that are part of the monitoring stack.
***Monitor Services Dashboard***

75
76
77
78
79
80
81
82
83
84
85
86
87
88
89
90
91
92
93
94
95
96
97
98
99
100
101
102
103
104
105
106
107
108
109
110
111
112
113
114
115
116
117
118
119
120
121
122
123
124
125
126
127
128
129
130
131
132
133
134
135
136
137
138
139
140
141
142
143
144
145
146
147
148
149
150
151
152
153
154
155
156
157
158
159
160
161
162
163
164
165
166
167
168
169
170
171
172
173
174
175
176
177
178
179
180
181
182
183
184
185
186
187
188
189
190
191
192
193
194
195
196
197
198
199
200
201
202
203
204
205
206
207
208
209
210
211
212
213
214
215
216
217
218
219
220
The Monitor Services Dashboard shows key metrics for monitoring the containers that make up the monitoring stack:
* Prometheus container uptime, monitoring stack total memory usage, Prometheus local storage memory chunks and series
* Container CPU Cores usage graph
* Container memory usage graph
* Prometheus samples ingested rate graph
* Prometheus target scrapes graph
* Prometheus scrape duration graph
* Prometheus targets HTTP requests graph
The Prometheus memory usage can be controlled by tunning the local storage memory chunks.
You can modify the max chunks value in [docker-compose.yml](https://github.com/stefanprodan/dockerprom/blob/master/docker-compose.yml).
I've set the `storage.local.memory-chunks` value to 100000, if you monitor 10 containers, then Prometheus will use up to 500MB RAM.
## Define alerts
You can define alerts in the [alert.rules](https://github.com/stefanprodan/dockerprom/blob/master/prometheus/alert.rules) file.
***Monitoring services alerts***
Trigger an alert if the monitoring targets (node-exporter and cAdvisor) are down for more then 30 seconds:
```yaml
ALERT monitor_service_down
IF up == 0
FOR 30s
LABELS { severity = "critical" }
ANNOTATIONS {
summary = "Monitor service non-operational",
description = "{{ $labels.instance }} of job {{ $labels.job }} is down.",
}
```
***Docker Host alerts***
Trigger an alert if the Docker host CPU is under hight load for more then 30 seconds:
```yaml
ALERT high_cpu_load
IF node_load1 > 1.5
FOR 30s
LABELS { severity = "warning" }
ANNOTATIONS {
summary = "Server under high load",
description = "{{ $labels.instance }} of job {{ $labels.job }} is under high load.",
}
```
Modify the load threshold based on your CPU cores.
Trigger an alert if the Docker host memory is almost full:
```yaml
ALERT high_memory_load
IF (sum(node_memory_MemTotal) - sum(node_memory_MemFree + node_memory_Buffers + node_memory_Cached) ) / sum(node_memory_MemTotal) * 100 > 85
FOR 30s
LABELS { severity = "warning" }
ANNOTATIONS {
summary = "Server memory is almost full",
description = "{{ $labels.instance }} of job {{ $labels.job }} memory usage is {{ humanize $value}}%.",
}
```
Trigger an alert if the Docker host storage is almost full:
```yaml
ALERT hight_storage_load
IF (node_filesystem_size{fstype="aufs"} - node_filesystem_free{fstype="aufs"}) / node_filesystem_size{fstype="aufs"} * 100 > 85
FOR 30s
LABELS { severity = "warning" }
ANNOTATIONS {
summary = "Server storage is almost full",
description = "{{ $labels.instance }} of job {{ $labels.job }} storage usage is {{ humanize $value}}%.",
}
```
***Docker Containers alerts***
Trigger an alert if a container is down for more then 30 seconds:
```yaml
ALERT jenkins_down
IF absent(container_memory_usage_bytes{name="jenkins"})
FOR 30s
LABELS { severity = "critical" }
ANNOTATIONS {
summary= "Jenkins down",
description= "Jenkins container is down for more than 30 seconds."
}
```
Trigger an alert if a container is using more then 10% of total CPU cores for more then 30 seconds:
```yaml
ALERT jenkins_high_cpu
IF sum(rate(container_cpu_usage_seconds_total{name="jenkins"}[5m])) / count(node_cpu{mode="system"}) * 100 > 10
FOR 30s
LABELS { severity = "warning" }
ANNOTATIONS {
summary= "Jenkins high CPU usage",
description= "Jenkins CPU usage is {{ humanize $value}}%."
}
```
Trigger an alert if a container is using more then 1,2GB of RAM for more then 30 seconds:
```yaml
ALERT jenkins_high_memory
IF sum(container_memory_usage_bytes{name="jenkins"}) > 1200000000
FOR 30s
LABELS { severity = "warning" }
ANNOTATIONS {
summary = "Jenkins high memory usage",
description = "Jenkins memory consumption is at {{ humanize $value}}.",
}
```
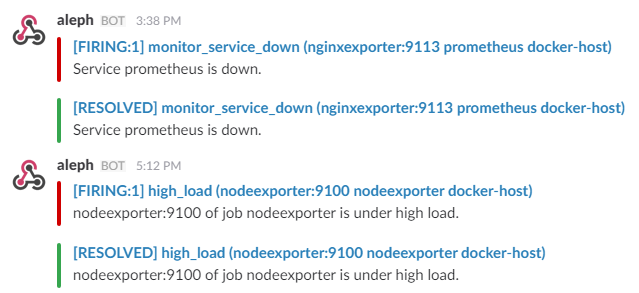
## Setup alerting
The AlertManager service is responsible for handling alerts sent by Prometheus server.
AlertManager can send notifications via email, PagerDuty, Slack, HipChat or any other system that exposes a webhook interface.
You can view and silence notifications by accessing `http://<host-ip>:9093`.
The notification receivers can be configured in [alertmanager/config.yml](https://github.com/stefanprodan/dockerprom/blob/master/alertmanager/config.yml) file.
To receive alerts via Slack you need to make a custom integration by choose ***incoming web hooks*** in your Slack team app page.
You can find more details on setting up Slack integration [here](http://www.robustperception.io/using-slack-with-the-alertmanager/).
Copy the Slack Webhook URL into the ***api_url*** field and fill the ***username*** and ***channel*** fields.
```yaml
route:
receiver: 'slack'
receivers:
- name: 'slack'
slack_configs:
- send_resolved: true
text: "{{ .CommonAnnotations.description }}"
username: '<username>'
channel: '#<channel>'
api_url: '<webhook-url>'
```