Newer
Older

A monitoring solution for Docker hosts and containers with [Prometheus](https://prometheus.io/), [Grafana](http://grafana.org/), [cAdvisor](https://github.com/google/cadvisor),
[NodeExporter](https://github.com/prometheus/node_exporter) and alerting with [AlertManager](https://github.com/prometheus/alertmanager).

## Install
Clone this repository on your Docker host, cd into dockprom directory and run compose up:
* `$ git clone https://github.com/stefanprodan/dockprom`
* `$ docker-compose up -d`

Containers:

* Prometheus (metrics database) `http://<host-ip>:9090`
* AlertManager (alerts management) `http://<host-ip>:9093`
* Granafa (visualize metrics) `http://<host-ip>:3000`
* NodeExporter (host metrics collector)
* cAdvisor (containers metrics collector)

While Granafa supports authentication, the Prometheus and AlertManager services have no such feature.
You can remove the ports mapping from the docker-compose file and use NGINX as a reverse proxy providing basic authentication for Prometheus and AlertManager.
## Setup Grafana

Navigate to `http://<host-ip>:3000` and login with user ***admin*** password ***changeme***. You can change the password from Granafa UI or
by modifying the [user.config](https://github.com/stefanprodan/dockprom/blob/master/user.config) file.
From the Granafa menu, choose ***Data Sources*** and click on ***Add Data Source***.
Use the following values to add the Prometheues container as data source:

* Name: Prometheus
* Type: Prometheus
* Url: http://prometheus:9090
* Access: proxy
Now you can import the dashboard temples from the [grafana](https://github.com/stefanprodan/dockprom/tree/master/grafana) directory.
From the Granafa menu, choose ***Dashboards*** and click on ***Import***.
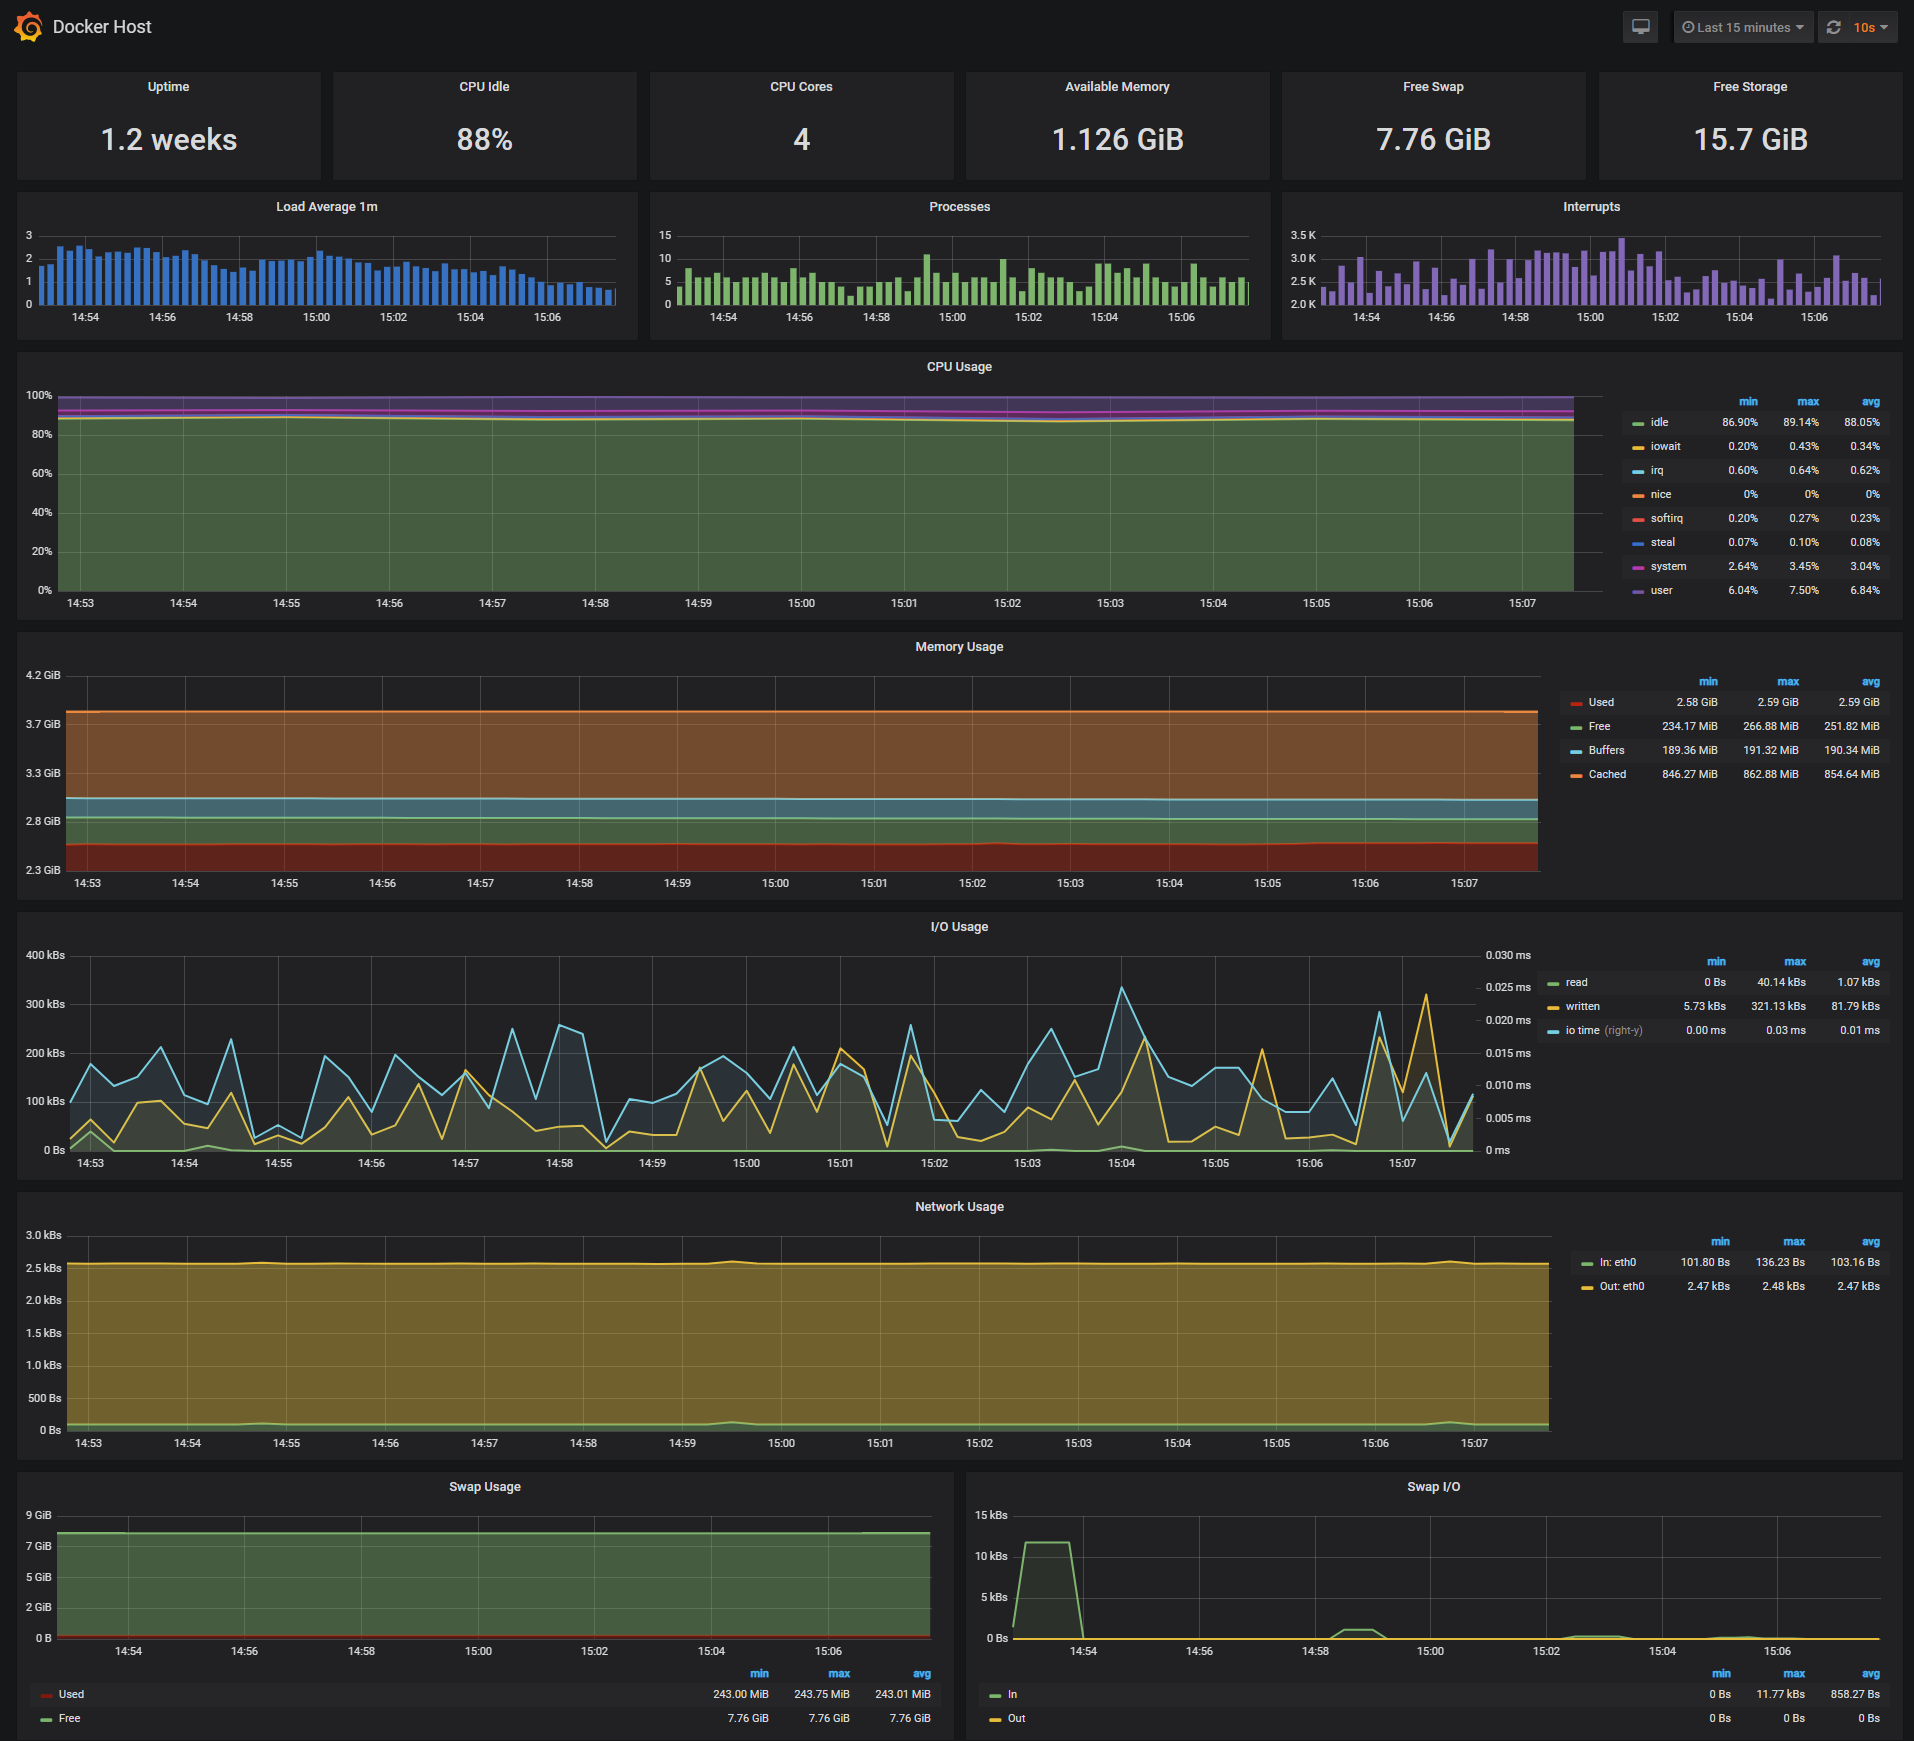
The Docker Host Dashboard shows key metrics for monitoring the resource usage of your server:

* Server uptime, CPU idle percent, numner of CPU cores, available memory, swap and storage
* System load average graph, running and blocked by IO processes graph, interrupts graph
* CPU usage graph by mode (guest, idle, iowait, irq, nice, softirq, steal, system, user)
* Memory usage graph by distribution (used, free, buffers, cached)
* IO usage graph (read Bps, read Bps and IO time)
* Network usage graph by device (inbound Bps, Outbound Bps)
* Swap usage and activity graphs
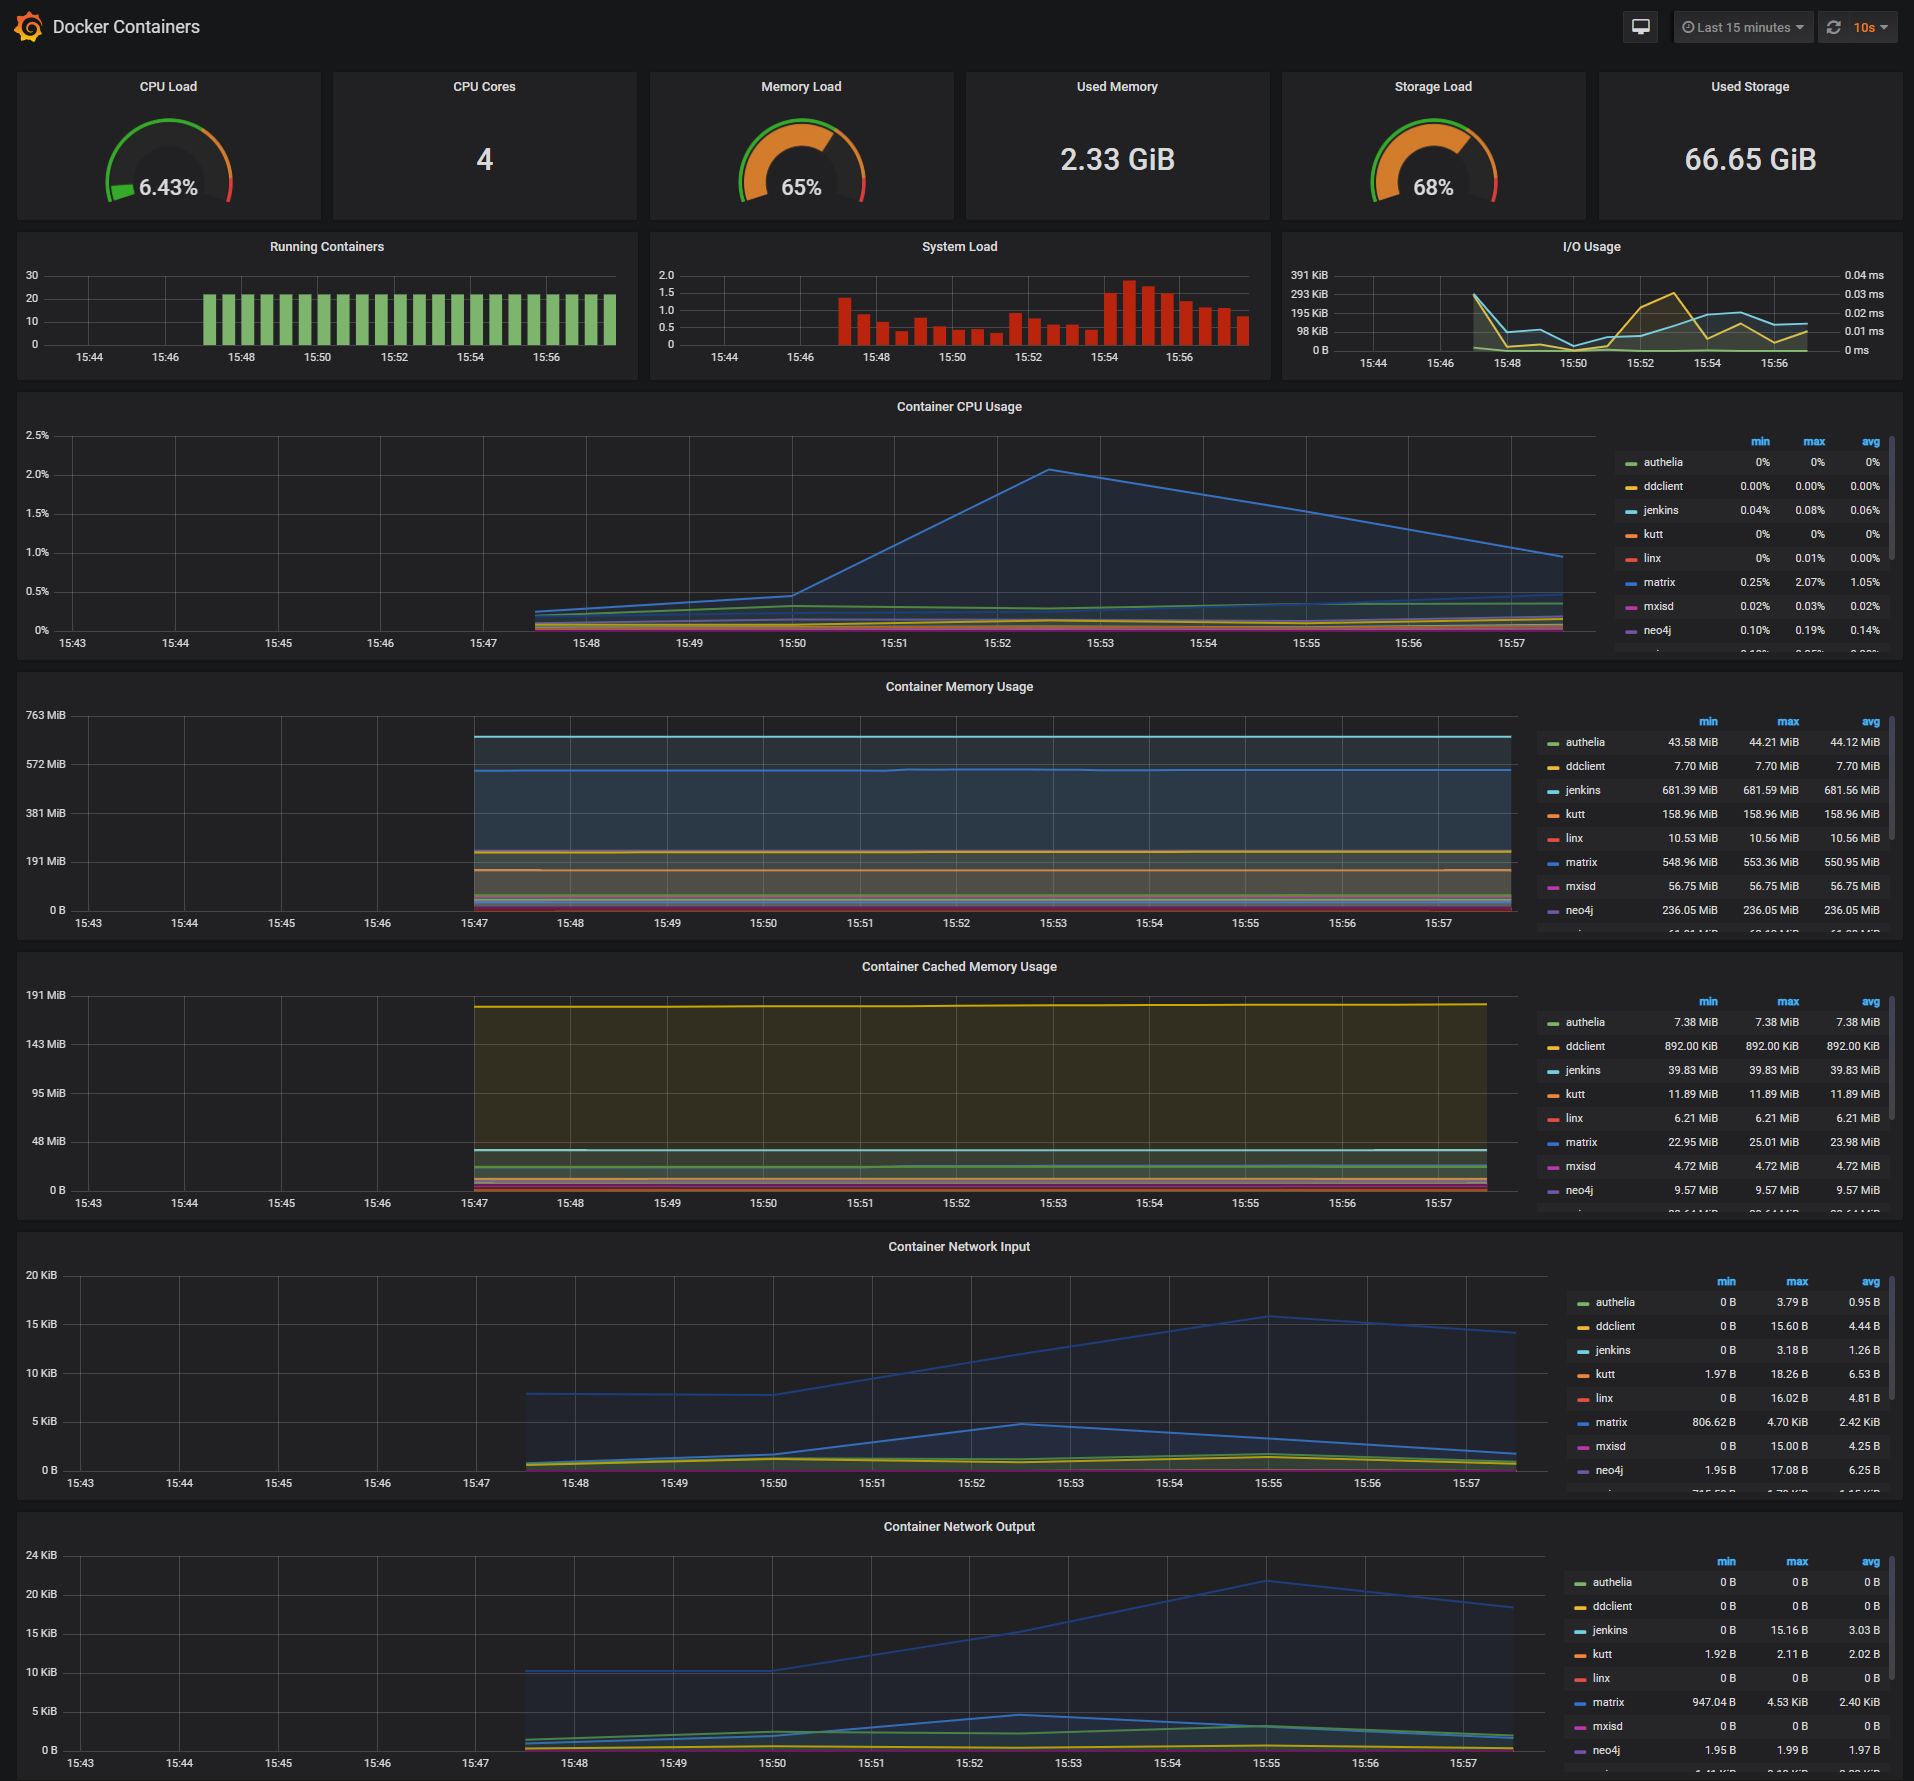
The Docker Containers Dashboard shows key metrics for monitoring running container:
* Total containers CPU load, memory and storage usage
* Running containers graph, system load graph, IO usage graph
* Container memory usage graph
* Container cached memory usage graph
* Container network inbound usage graph
* Container network outbound usage graph
Note that this dashboard doesn't show the containers that are part of the monitoring stack.
***Monitor Services Dashboard***
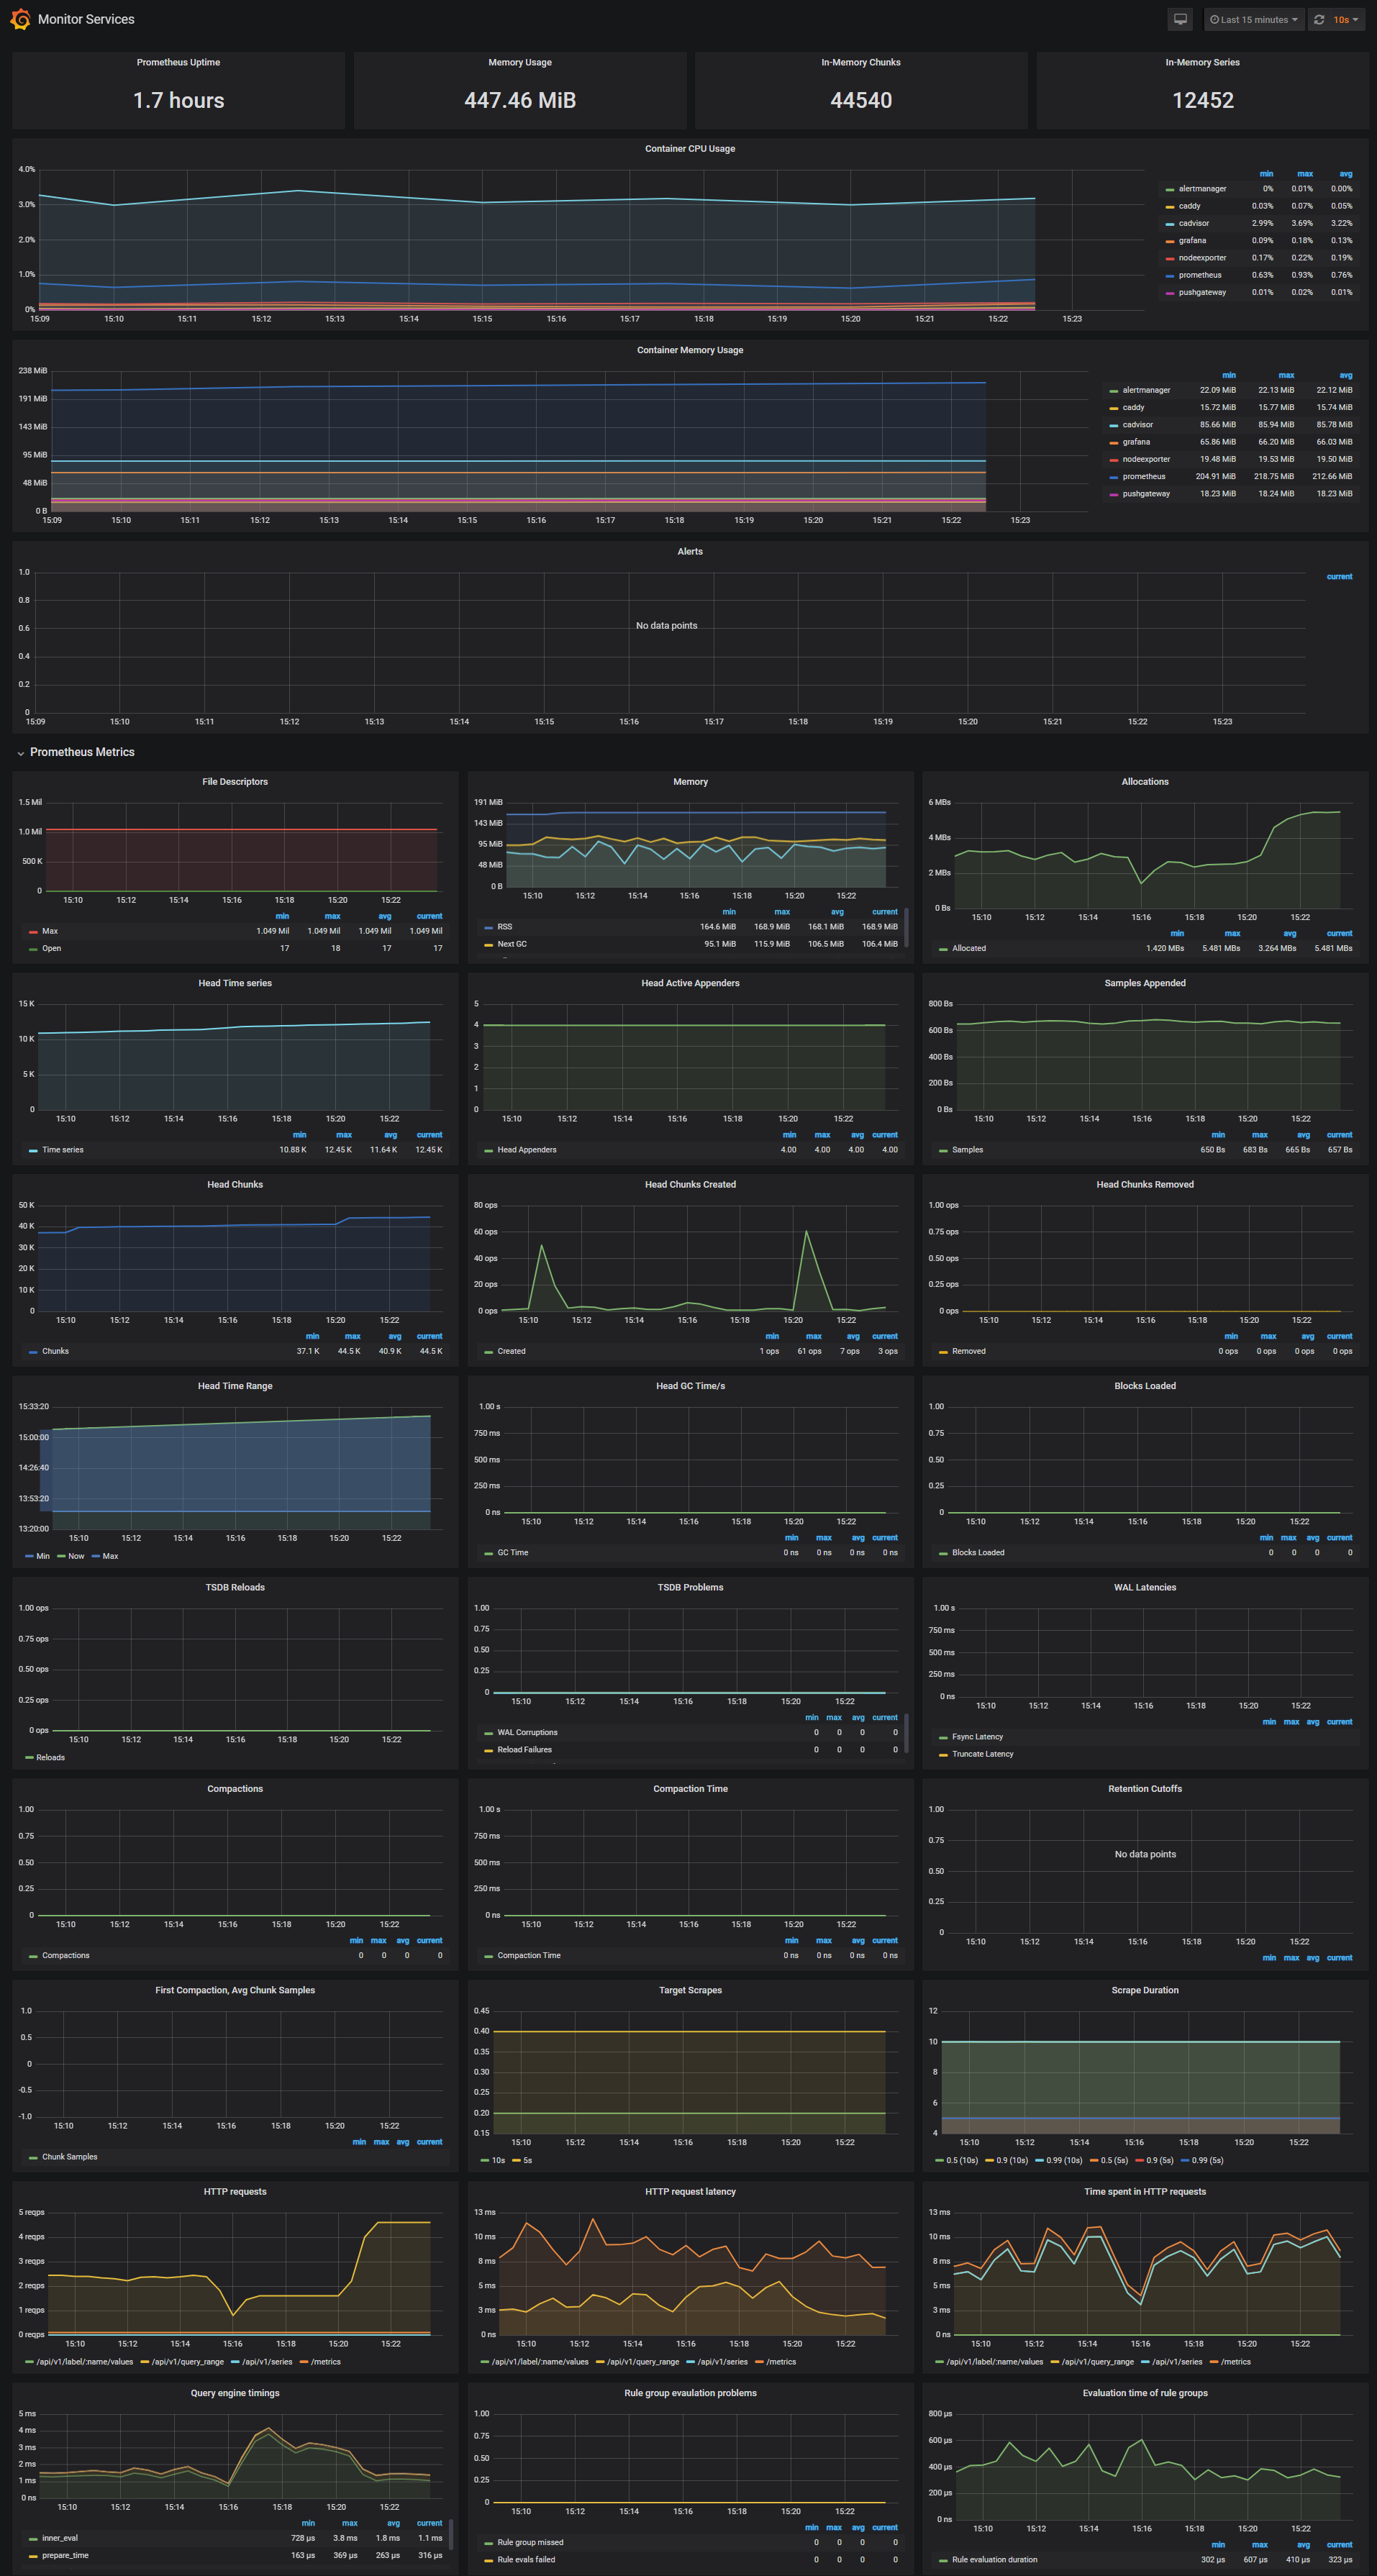
The Monitor Services Dashboard shows key metrics for monitoring the containers that make up the monitoring stack:

* Prometheus container uptime, monitoring stack total memory usage, Prometheus local storage memory chunks and series
* Prometheus chunks to persist and persistence urgency graphs
* Prometheus chunks ops and checkpoint duration graphs
* Prometheus samples ingested rate, target scrapes and scrape duration graphs
* Prometheus HTTP requests graph
* Prometheus alerts graph
The Prometheus memory usage can be controlled by tunning the local storage memory chunks.
You can modify the max chunks value in [docker-compose.yml](https://github.com/stefanprodan/dockprom/blob/master/docker-compose.yml).
I've set the `storage.local.memory-chunks` value to 100000, if you monitor 10 containers, then Prometheus will use around 1GB of RAM.
I've setup three alerts configuration files:

* Monitoring services alerts [targets.rules](https://github.com/stefanprodan/dockprom/blob/master/prometheus/targets.rules)
* Docker Host alerts [hosts.rules](https://github.com/stefanprodan/dockprom/blob/master/prometheus/hosts.rules)
* Docker Containers alerts [containers.rules](https://github.com/stefanprodan/dockprom/blob/master/prometheus/containers.rules)
You can modify the alert rules and reload them by making a HTTP POST call to Prometheus:

```
curl -X POST http://<host-ip>:9090/-/reload
```
***Monitoring services alerts***
Trigger an alert if any of the monitoring targets (node-exporter and cAdvisor) are down for more then 30 seconds:
```yaml
ALERT monitor_service_down
  IF up == 0
  FOR 30s
  LABELS { severity = "critical" }
  ANNOTATIONS {
      summary = "Monitor service non-operational",
description = "{{ $labels.instance }} service is down.",
  }
```

***Docker Host alerts***

Trigger an alert if the Docker host CPU is under hight load for more then 30 seconds:

```yaml
ALERT high_cpu_load
  IF node_load1 > 1.5
  FOR 30s
  LABELS { severity = "warning" }
  ANNOTATIONS {
      summary = "Server under high load",
description = "Docker host is under high load, the avg load 1m is at {{ $value}}. Reported by instance {{ $labels.instance }} of job {{ $labels.job }}.",
  }
```

Modify the load threshold based on your CPU cores.

Trigger an alert if the Docker host memory is almost full:

```yaml
ALERT high_memory_load
  IF (sum(node_memory_MemTotal) - sum(node_memory_MemFree + node_memory_Buffers + node_memory_Cached) ) / sum(node_memory_MemTotal) * 100 > 85
  FOR 30s
  LABELS { severity = "warning" }
  ANNOTATIONS {
      summary = "Server memory is almost full",
description = "Docker host memory usage is {{ humanize $value}}%. Reported by instance {{ $labels.instance }} of job {{ $labels.job }}.",
  }
```

Trigger an alert if the Docker host storage is almost full:

```yaml
ALERT hight_storage_load
  IF (node_filesystem_size{fstype="aufs"} - node_filesystem_free{fstype="aufs"}) / node_filesystem_size{fstype="aufs"}  * 100 > 85
  FOR 30s
  LABELS { severity = "warning" }
  ANNOTATIONS {
      summary = "Server storage is almost full",
description = "Docker host storage usage is {{ humanize $value}}%. Reported by instance {{ $labels.instance }} of job {{ $labels.job }}.",
  }
```

***Docker Containers alerts***

Trigger an alert if a container is down for more then 30 seconds:

```yaml
ALERT jenkins_down
  IF absent(container_memory_usage_bytes{name="jenkins"})
  FOR 30s
  LABELS { severity = "critical" }
  ANNOTATIONS {
    summary= "Jenkins down",
    description= "Jenkins container is down for more than 30 seconds."
  }
```

Trigger an alert if a container is using more then 10% of total CPU cores for more then 30 seconds:

```yaml
 ALERT jenkins_high_cpu
IF sum(rate(container_cpu_usage_seconds_total{name="jenkins"}[1m])) / count(node_cpu{mode="system"}) * 100 > 10
  FOR 30s
  LABELS { severity = "warning" }
  ANNOTATIONS {
    summary= "Jenkins high CPU usage",
    description= "Jenkins CPU usage is {{ humanize $value}}%."
  }
```

Trigger an alert if a container is using more then 1,2GB of RAM for more then 30 seconds:

```yaml
ALERT jenkins_high_memory
  IF sum(container_memory_usage_bytes{name="jenkins"}) > 1200000000
  FOR 30s
  LABELS { severity = "warning" }
  ANNOTATIONS {
      summary = "Jenkins high memory usage",
      description = "Jenkins memory consumption is at {{ humanize $value}}.",
  }
```

## Setup alerting

The AlertManager service is responsible for handling alerts sent by Prometheus server.
AlertManager can send notifications via email, Pushover, Slack, HipChat or any other system that exposes a webhook interface.
A compleat list of integrations can be found [here](https://prometheus.io/docs/alerting/configuration).
You can view and silence notifications by accessing `http://<host-ip>:9093`.
The notification receivers can be configured in [alertmanager/config.yml](https://github.com/stefanprodan/dockprom/blob/master/alertmanager/config.yml) file.
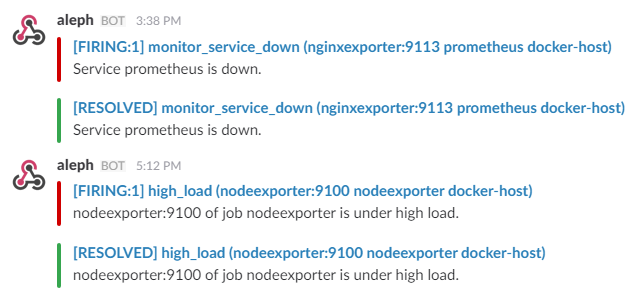
To receive alerts via Slack you need to make a custom integration by choose ***incoming web hooks*** in your Slack team app page.
You can find more details on setting up Slack integration [here](http://www.robustperception.io/using-slack-with-the-alertmanager/).
Copy the Slack Webhook URL into the ***api_url*** field and specify a Slack ***channel***.
```yaml
route:
    receiver: 'slack'

receivers:
    - name: 'slack'
      slack_configs:
          - send_resolved: true
            text: "{{ .CommonAnnotations.description }}"
api_url: 'https://hooks.slack.com/services/<webhook-id>'